
Our GrowByData experts gathered and monitored the performance of ads for the Electronics category on Google Shopping for the month of January 2021. Using our competitive Ad Intelligence tool , we found a total of 186,773 ads from 1,466 sellers on shopping ads data from 458 highly competitive opportunity keywords for the Electronics category.
Learn more about Ad Intelligence and its impact on ad performance.
Looking at the ad coverage on devices, 71% of total ads were seen on mobile devices, while conversely, only 29% were only seen on desktop devices. In this case, electronics advertisers have more opportunities to improve their presence on desktops. Similarly, in the ad type distribution, 98% of the ads were Shopping Ads (PLAs), and only 2% were Showcase Ads. This indicates that there is plenty of room for improvement in the distribution of showcase ads.
Ad Trend for January 2021
We collected the daily ad data from January 1st to the 31st for the electronics category from all across the U.S.
Total Ads: 186,773 Total Advertisers: 1,466 Number of Keywords: 458 Unique Ad Titles: 12,492
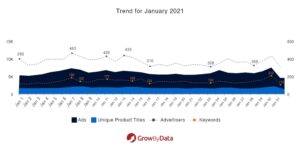
The above graph represents the trend of ads, advertisers, keywords, and products on a day-to-day basis. It shows that the ads and the number of advertisers seen in the electronics category were quite steady during the month of January.
Regional Distribution of Ads
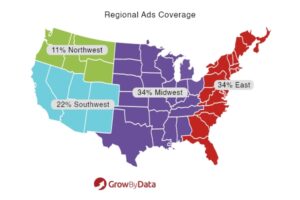
The regional ad coverage shows the visibility of the ads in the four U.S. regions, by showing which region had the highest and the lowest coverage in terms of ad distributions. As per our graph below, the electronics category shared the highest coverage, 34%, in the East and Midwest regions, followed by the Southwest region with 22%, and the Northwest region had the lowest coverage, at 11%.
Top 5 Advertisers based on Ad Coverage
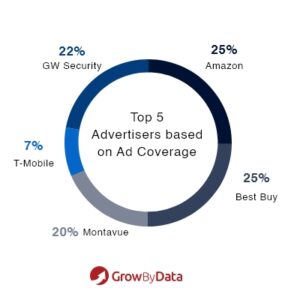
Below are the top advertisers based on the highest number of ad impressions in January, for the Electronics category. Among the top five advertisers, Amazon and Best Buy shared the highest ad coverage (25%) followed by GW Security (22%), Montavue (20%), and T-Mobile (7%), completing the list.
Per Region: Top 5 Advertisers based on Ad Coverage
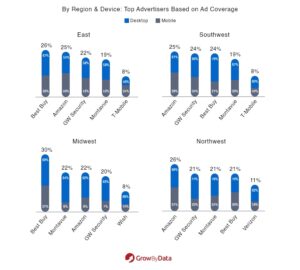
We also investigated the top five advertisers in each of the four regions. While a few of the advertisers were in the top in all four regions, advertisers like T-Mobile made the top 5 list only in the East and Midwest regions, Wish in the Southwest, and Verizon in the Northwest region – meaning they had good impressions in just these regions.
This also indicated that they had opportunities to improve in other regions as well. The graph below shows the ad coverage of advertisers, based on the device they were getting their ad impressions in, for each region. The majority of their ads were seen on mobile devices in all four regions, compared to desktop devices.
Advertisers by Ad Rank
The graph below shows the top five advertisers based on the highest percentage of ads at each rank in the electronics category. GW Security secured the highest percentage of their ads in all the ranks from one to five, followed by Amazon, Montavue, Best Buy, and Dell.
![]()
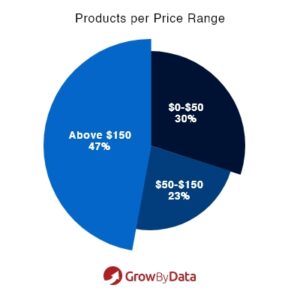
Products Per Price Range
Looking into the price range of products, we found that 47% of the products were in the price range above $150. The $0-$50 price range had 30% of products and 23% of products were $50-$150 price range.
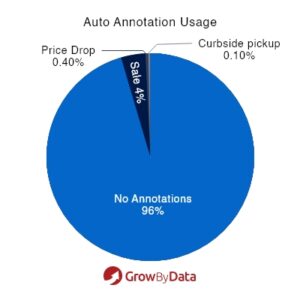
Use of Auto Annotations
Our data showed that auto annotations such as ‘sale annotations’, ‘price drop annotations’, and ‘curbside pickup’ were showing up on ads for the electronics category. Among the ads that had auto annotations, we saw the ‘sale’ annotation was used more often than any of the other auto annotations.
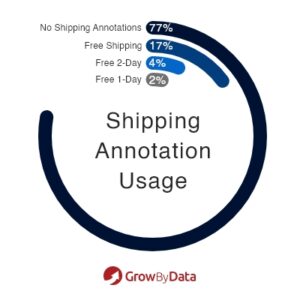
Use of Shipping Annotations
As per our data, around 23% of the ads had shipping annotations on them. ‘Free Shipping’ was the most popular option, followed by ‘Free 2 Day’ and ‘Free 1-Day’ shipping annotations.
Use of Local Inventory Ads
Our data showed only 10% of ads had local inventory ads and the remaining 90% had no local inventory annotations. This is potentially an area of opportunity that local advertisers can focus on to increase their ad visibility.

Use of Ratings and Reviews
Further analyzing our data, 20% of electronic ads on Google Shopping had a rating score of more than four, while only 3% of ads had a rating score of more than three. Similarly, 16% of ads had more than 100 reviews, while 8% of ads had less than 100 reviews on them, as shown on the charts below.

Conclusion
By using our Google Shopping market analysis on the electronics category, retailers can boost their ad impression and visibility in the marketplace to gain a competitive edge. Likewise, our Search Intelligence Software will continue to monitor and track the market trend of the electronics category, to see if the patterns above hold, or if they shift in the coming months.
Likewise, learn more about Market trends in the apparel & accessories category in 2023.
