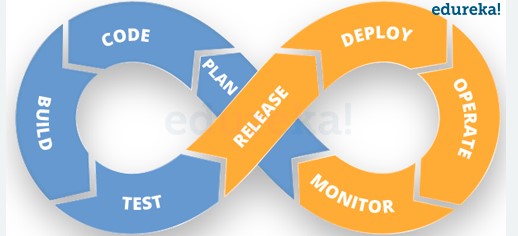
Prometheus is an open-source monitoring and alerting toolkit designed for modern DevOps practices. It plays a crucial role in the field of DevOps by providing a robust solution for monitoring the health, performance, and availability of software applications and infrastructure components. Prometheus is particularly well-suited for dynamic, cloud-native environments, where scalability, flexibility, and real-time insights are essential.
At its core, Prometheus collects time-series data from various sources, such as application metrics, system metrics, and other monitoring targets. It stores this data in a time-series database, allowing users to query and analyze historical and real-time performance metrics. Apart from it y obtaining DevOps Training, you can advance your career in DevOps. With this course, you can demonstrate your expertise in Power BI Desktop, Architecture, DAX, Service, Mobile Apps, Reports, many more fundamental concepts, and many more critical concepts among others.
Key features and concepts of Prometheus in the context of DevOps include:
1. **Data Collection:** Prometheus employs a “pull” model for data collection, where it regularly scrapes data from targets using HTTP. Applications and services expose metrics through HTTP endpoints, and Prometheus pulls these metrics at specified intervals.
2. **Data Model:** Prometheus uses a multidimensional data model where each data point is identified by a set of key-value pairs, including metric names and labels. Labels provide additional context and dimensions for the metrics, enabling efficient querying and filtering.
3. **PromQL:** Prometheus Query Language (PromQL) allows users to perform complex queries and aggregations on the collected metrics. PromQL supports a wide range of operations, enabling users to derive insights and analyze trends from the data.
4. **Alerting:** Prometheus includes a powerful alerting system that enables users to define rules based on metric thresholds or patterns. When a rule is triggered, Prometheus can send alerts to various alerting mechanisms, such as email, Slack, or other integrations.
5. **Scalability:** Prometheus is designed to scale horizontally, allowing users to deploy multiple instances to handle increasing data volumes. It employs federation and sharding techniques to manage data distribution and aggregation across instances.
6. **Service Discovery:** Prometheus supports various service discovery mechanisms, such as static configuration files, Kubernetes service discovery, and dynamic service discovery. This makes it easy to monitor containerized applications and dynamic infrastructure.
7. **Integration:** Prometheus can be integrated with various applications and services using exporters or agents that expose metrics in the Prometheus format. A rich ecosystem of exporters is available for popular technologies, making it simple to monitor a wide range of systems.
8. **Visualization:** While Prometheus itself focuses on data collection and storage, it often works in conjunction with visualization tools like Grafana. Grafana can be used to create rich and customizable dashboards that visualize Prometheus data.
9. **Alertmanager:** Prometheus is complemented by Alertmanager, which handles alert notifications, deduplication, grouping, and routing. Alertmanager ensures that alerts are managed effectively and delivered to the appropriate channels.
Prometheus is widely adopted in the DevOps community due to its ability to provide deep insights into application and infrastructure performance. It supports the proactive identification of issues, facilitates capacity planning, and assists in maintaining high availability. By enabling real-time monitoring, alerting, and visualization, Prometheus empowers DevOps teams to respond to incidents promptly, optimize resources efficiently, and enhance the overall reliability and performance of their systems.


